


📊 Svelte Charts with Chart.js #
In this Svelte charts post, we see how you can quickly add customizable charts to your Svelte app using Chart.js. You should find this post useful, in fact, if you are creating a dashboard or console and need to throw in some charts. Alternatively, you might be writing an article summarizing some data. You should find the post equally useful for these use cases and many others. Although we focus on SvelteKit, we have tested the approach on Astro and it should be easily adapted to other Svelte frameworks.
🧱 What we’re Building #
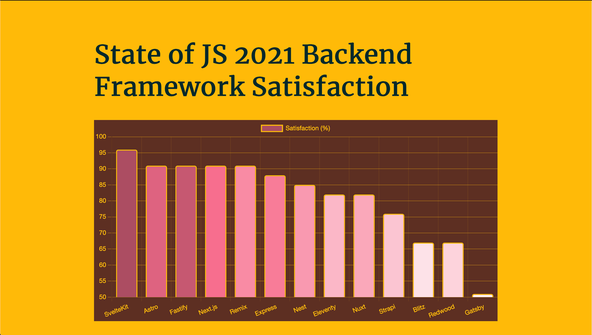
We will create a bar chart from the State of JS 2021 survey results. Locally, we will source the data from a JSON file. After importing the data, we will then add some custom styling and see configuration changes which you need for Chart.js to work smoothly with SvelteKit. You will see that with minimal effort you can knock up something with Chart.js and Svelte which does not look too bad at all!

🚀 Quick Start #
There’s not all that much to do. You will probably find you spend most time on customizing the charts to show your research or data in its best light. To get going, why don’t we spin up a new SvelteKit project from the Terminal:
pnpm dlx sv create svelte-charts && cd $_pnpm installpnpm dev
I chose the TypeScript option along with ESLint and Prettier, but no Browser testing. If this is your first time using TypeScript with SvelteKit, then you might want to check out the Starting out Svelte and SvelteKit tutorial which gives a little more colour on using SvelteKit with TypeScript. We use the Merriweather font self-hosted below, so you might also want to install that now, along with the Chart.js package (and its types):
pnpm add -D @fontsource/merriweather @types/chart.js chart.js
⚙️ Svelte Charts: JSON Data #
Probably the most important part of this project are the data! We will add
them in a JSON file, then use Vite’s JSON import feature to import them
onto our chart page. Create a new src/lib/data folder
and in there, make a satisfaction.json file and
paste in this content:
{ "FY2021": [ { "framework": "SvelteKit", "score": 96 }, { "framework": "Astro", "score": 91 }, { "framework": "Fastify", "score": 91 }, { "framework": "Next.js", "score": 91 }, { "framework": "Remix", "score": 91 }, { "framework": "Express", "score": 88 }, { "framework": "Nest", "score": 85 }, { "framework": "Eleventy", "score": 82 }, { "framework": "Nuxt", "score": 82 }, { "framework": "Strapi", "score": 76 }, { "framework": "Blitz", "score": 67 }, { "framework": "Redwood", "score": 67 }, { "framework": "Gatsby", "score": 51 } ]}
First Try #
Chart.js uses an HTML canvas element to create the chart in. Typically, you
can just create a div with an id and use JavaScript
to find that id and attach the chart. However, Svelte
lets us bind elements to JavaScript variables, so we will use that approach. Replace
the code in src/routes/+page.svelte with the following:
1 <script lang="ts">2 import { browser } from '$app/environment';3 import { FY2021 as satisfactionData2021 } from '$lib/data/satisfaction.json';4 import '@fontsource/merriweather';5 import { Chart, registerables } from 'chart.js';6 import { onMount } from 'svelte';7 8 Chart.register(...registerables);9 10 let barChartElement: HTMLCanvasElement;11 12 const chartData = {13 labels: satisfactionData2021.map(({ framework }) => framework),14 datasets: [15 {16 label: 'Satisfaction (%)',17 data: satisfactionData2021.map(({ score }) => score),18 backgroundColor: [19 'hsl(347 38% 49%)',20 'hsl(346 65% 63%)',21 'hsl(346 49% 56%)',22 'hsl(346 89% 70%)',23 'hsl(346 90% 76%)',24 'hsl(346 90% 73%)',25 'hsl(346 89% 79%)',26 'hsl(346 89% 85%)',27 'hsl(347 89% 82%)',28 'hsl(346 90% 88%)',29 'hsl(347 87% 94%)',30 'hsl(347 91% 91%)',31 'hsl(346 87% 97%)',32 ],33 borderColor: ['hsl(43 100% 52%)'],34 borderRadius: 4,35 borderWidth: 2,36 },37 ],38 };39 40 onMount(() => {41 if (browser) {42 new Chart(barChartElement, {43 type: 'bar',44 data: chartData,45 options: {46 plugins: {47 legend: {48 display: false,49 },50 },51 scales: {52 x: {53 grid: {54 color: 'hsl(43 100% 52% / 10%)',55 },56 ticks: { color: 'hsl(43 100% 52% )' },57 },58 y: {59 beginAtZero: false,60 ticks: { color: 'hsl(43 100% 52% )', font: { size: 18 } },61 grid: {62 color: 'hsl(43 100% 52% / 40%)',63 },64 title: {65 display: true,66 text: 'Satisfaction (%)',67 color: 'hsl(43 100% 52% )',68 font: { size: 24, family: 'Merriweather' },69 },70 },71 },72 },73 });74 }75 });76 </script>77 78 <main class="main-container">79 <h1>State of JS 2021 Backend Framework Satisfaction</h1>80 <section>81 <canvas bind:this={barChartElement} ></canvas>82 </section>83 </main>
This will not work out-of-the-box, so let’s first see how to fix it then have a closer look at the code.
Using Chart.js with SvelteKit #
You will probably get a registerables is not iterable error in your browser. This is just because although Chart.js ships with ESM
support it does not currently work out-of-the-box with SvelteKit. No sweat though,
we can fix this with a few lines of config .
Add Vite SSR config vite.config.js to sort this
issue:
1 import { sveltekit } from '@sveltejs/kit/vite';2 3 /** @type {import('vite').UserConfig} */4 const config = {5 ssr: {6 noExternal: ['chart.js'],7 },8 };9 10 export default config;
Give that a save then jump back to your browser, and it should all be right as rain.
👀 A Closer Look at the Code #
In line 3 of src/routes/index/+page.svelte we import the top level JSON data as a named import. If you didn’t know
you could do this with Vite or SvelteKit, check out the
short video on Svelte JSON imports.
Jumping down to line 81 we see where we include
the chart in our markup. Adding bind:this on the
canvas element lets us bind our element to a JavaScript
variable. We declare that variable in line 10.
In lines 12 – 38 we get our data into
a format which Chart.js expects. As examples, labels (line 13) is just an array of text labels
for each data point. We create it using the JavaScript map method to extract
just the framework field from each data point in
our input JSON. We do something very similar in line 17 to extract the actual value for each data point. Then, backgroundColor is just an array of colours to use for the bars. I generated some tints and shades
using the What-a-colour app. You can create and customize this app yourself in the Starting out Svelte and SvelteKit
tutorial . We also look at converting colours between hex and HSL and generating
contrast ratios for a chosen colour palette.
Chart.js Initialization #
The Svelte onMount method is for any setting up
we need to do after the initial render of our page. That works here because we need
an initial render in order to have a canvas element
to attach the chart to. In line 43, we create
a Chart object, attaching it to barChartElement (our canvas element). We add minimal customization
in the following lines. This is just to give you a flavour of what is possible.
Go to town on your own app. You will find a mountain of material on customization in the Chart.js docs .
💄 Svelte Charts: a Little Style #
The chart looks a little plain, albeit with the pink bars! We will see how to
change the chart background colour in a moment. Before that though, here are
some styles for the app itself. Paste this content at the end of src/routes/+page.svelte:
85 <style>86 .main-container {87 width: min(100% - var(--spacing-12), var(--max-width-wrapper));88 margin: var(--spacing-18) auto;89 }90 </style>
Then create a src/lib/styles directory. In there,
add a global.css file with this content:
1 html {2 background-color: var(--colour-theme);3 font-family: Merriweather;4 }5 h1 {6 color: var(--colour-dark);7 font-size: var(--font-size-6);8 }9 :root {10 --colour-theme: hsl(43 100% 52%); /* selective yellow */11 --colour-brand: hsl(13 46% 25%); /* irish coffee */12 --colour-alt: hsl(346 89% 70%); /* froly */13 --colour-light: hsl(75 100% 98%); /* ceramic */14 --colour-dark: hsl(182 83% 9%); /* tiber */15 16 --spacing-12: 3rem;17 --spacing-18: 4.5rem;18 19 --max-width-wrapper: 48rem;20 21 --font-size-6: 3.052rem;22 }
Then import these global styles at the top of the +page.svelte file:
85 <script lang="ts">86 import { browser } from '$app/environment';87 import { FY2021 as satisfactionData2021 } from '$lib/data/satisfaction.json';88 import '$lib/styles/global.css';89 import '@fontsource/merriweather';90 import { Chart, registerables } from 'chart.js';91 import { onMount } from 'svelte';
As a final step, we will see how to change the chart background colour, then the customary test!
🎨 Svelte Charts: Changing Background Colour #
For Chart.js charts, you can change the background colour by updating the canvas element’s background. You could push the boat out and add a picture for the background by tweaking the method we use here. We will keep it simple though and go for a solid colour. To do that, we create a Chart.js plugin. Although that sounds overwhelming, it reality it’s just a few extra lines of code.
Update src/lib/routes/+page.svelte:
40 onMount(() => {41 if (browser) {42 chart = new Chart(barChartElement, {43 type: 'bar',44 data: chartData,45 plugins: [46 {47 id: 'custom_canvas_background_colour',48 beforeDraw: (chart: Chart) => {49 const ctx = chart.canvas.getContext('2d');50 if (ctx) {51 ctx.save();52 ctx.globalCompositeOperation = 'destination-over';53 ctx.fillStyle = 'hsl(13 46% 25%)';54 ctx.fillRect(0, 0, chart.width, chart.height);55 ctx.restore();56 }57 },58 },59 ],60 options: {61 plugins: {62 legend: {63 display: false,64 },65 },66 scales: {67 x: {68 grid: {69 color: 'hsl(43 100% 52% / 10%)',70 },71 ticks: { color: 'hsl(43 100% 52% )' },72 },73 y: {74 beginAtZero: false,75 ticks: { color: 'hsl(43 100% 52% )', font: { size: 18 } },76 grid: {77 color: 'hsl(43 100% 52% / 40%)',78 },79 title: {80 display: true,81 text: 'Satisfaction (%)',82 color: 'hsl(43 100% 52% )',83 font: { size: 24, family: 'Merriweather' },84 },85 },86 },87 },88 });89 }90 });
We actually set the background colour to “Irish Coffee” using HSL
in line 53. That’s all there is to
create a chart in Svelte using Chart.js.
🗳 Poll #
💯 SvelteCharts: Testing it Out #
This is how your page should look:
Please enable JavaScript to watch the video 📼
Hope you are as impressed as I am with how little effort we needed to create something fairly respectable.
🙌🏽 Svelte Charts: Wrapup #
In this Svelte Charts post, we have seen how quickly to create charts in Svelte. In particular, we have touched on:
- using Chart.js with Svelte including initializing a chart and customizing styles;
- adding a background colour to a Chart.js bar chart; and
- Vite configuration for using Chart.js with SvelteKit.
This has just been an introduction with using Svelte with Chart.js. You can use the code here as a stepping stone for creating Svelte Pie Charts, Line Charts and so much more. Check Chart.js docs for more on the config for these other chart types, then just drop it into your Svelte code. Let me know what you end up creating. You can drop a comment below or reach out for a chat on Element as well as Twitter @mention
You can see the full code for this Svelte Chart project, in all its glory in the Rodney Lab Git Hub repo .
🏁 Svelte Charts: Summary #
How can you add charts to your Svelte app? #
- A promising solution for adding charts to your Svelte app is Pancake.js from Rich Harris; the Svelte creator. That library is quite new at the time of writing though and there is limited documentation. A nice alternative is Chart.js. There is extensive documentation, for example on creating bar charts, pie charts, line charts and more. You can also customize the charts to present your data in their best light with styling to match your own taste.
Does Chart.js work with SvelteKit? #
- Yes, Chart.js has ESM support and works with SvelteKit. However, it does not work out of the box. Despite that, you only need a few lines of config to have the two paying nicely together. Open up your `svelte.config.js` files and under the `kit` options add `vite.ssr.noExternal: ['chart.js']`, That's it. You can now spin up your dev server as normal or run a local build then preview.
How do you change Chart.js background colour? #
- Chart.js is quite customizable, and you can change fonts and styling in the Chart.js configuration object. Chart.js creates your charts on an HTML5 Canvas. To change background colour, one option is actually just to change the colour of the canvas which the chart is drawn on. We have seen you can add a Chart.js plugin to do this. In reality, this can just be an extra few lines in the Chart.js configuration object. Here just get the canvas context using `const ctx = chart.canvas.getContext('2d')`, then be sure to set `ctx.fillStyle = 'some-colour';`. In fact, you can even tweak this to set an image as the background, instead of a solid colour.
🙏🏽 Svelte Charts: Feedback #
If you have found this video useful, see links below for further related content on this site. I do hope you learned one new thing from the video. Let me know if there are any ways I can improve on it. I hope you will use the code or starter in your own projects. Be sure to share your work on Twitter, giving me a mention, so I can see what you did. Finally, be sure to let me know ideas for other short videos you would like to see. Read on to find ways to get in touch, further below. If you have found this post useful, even though you can only afford even a tiny contribution, please consider supporting me through Buy me a Coffee.


Just finished a new FREE post on how you can use Chart.js with ❤️ Svelte.
— Rodney (@askRodney) June 22, 2022
We look at setup as well as styling and configuration, including changing the canvas background colour.
Hope you find it useful!
#learnsvelte #askRodney #sveltejs https://t.co/jtDOXJIYQt
Finally, feel free to share the post on your social media accounts for all your followers who will find it useful. As well as leaving a comment below, you can get in touch via @askRodney on Twitter and also askRodney on Telegram . Also, see further ways to get in touch with Rodney Lab. I post regularly on SvelteKit as well as Search Engine Optimization among other topics. Also, subscribe to the newsletter to keep up-to-date with our latest projects.